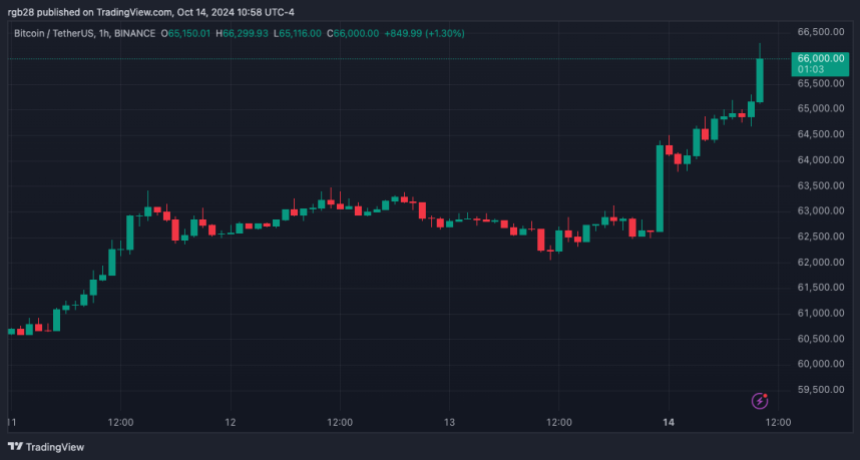
Bitcoin (BTC), the largest cryptocurrency by market capitalization, started the third week of October with a 6% daily surge. BTC’s performance has fueled bullish sentiment among crypto investors and market watchers, who suggest it might be ready to move to $70,000.
Related Reading
Bitcoin Reclaims Key Support Levels
Bitcoin began the week reclaiming key resistance levels after a 6% surge from Sunday’s price. This performance saw BTC move from the $62,000 support zone to retest the $66,000 support area on Monday morning.
Following the recent performance, Bitcoin’s October returns so far have turned green with a 3.17% monthly return, according to Coinglass data. Crypto analyst Rekt Capital highlighted Bitcoin’s recent movements, noting that BTC has been able to reclaim a 2-month downtrend as support.
Per the analyst, the flagship cryptocurrency has retested a downtrend line dating back to late July since October started. BTC successfully retested and bounced from the trendline for two consecutive weeks, turning the range into support.
Additionally, the analyst pointed out that Bitcoin has performed several successful retests, including a “volatile retest” of the 21-week Bull Market Exponential Moving Average (EMA).
“Notice how the bottom of the green boxed area is confluent with the July Downtrend retest and the retest of the 21-week EMA is confluent with the top of the green box,” the analyst added.
Similarly, Ali Martinez highlighted that BTC is currently making another attempt to reclaim the 200-day Moving Average after four consecutive rejections in the past two months.
BTC Challenges August Highs
Rekt Capital noted that BTC has solidified the $58,000-$61,000 range as a support area throughout the year: “It has done so at a Higher Low compared to last month’s downside wicking lows as well as August’s downside wicking lows.”
Moreover, the analyst stated that Bitcoin challenged August highs, at around $64,200, after the recent retests of the key levels. He suggested that BTC’s recent movements are a “clear sign” that August’s level is “weakening as resistance.”
Rekt Capital pointed out BTC is retesting the multi-month weekly downtrend channel top, which is also weakening as resistance. The flagship cryptocurrency successfully tested the channel’s range lows as support this month.
The range lows have been 7-month confluent support with the previous all-time high (ATH) area. Nonetheless, the analyst noted that BTC must have a weekly close above the downtrend channel’s top to break out of this pattern.
A weekly close above August highs, followed by a successful retest of this level, would “pose a significant buy-side pressure on the Downtrending Channel Top,” which could be accelerated if BTC’s daily close sits above $64,200.
Related Reading
Moreover, a daily close above $65,000 and a successful reclaim of the range as a support zone could send BTC’s price toward the $70,000 resistance zone. The analyst noted that whenever Bitcoin closed the day above this level, the cryptocurrency moved within the $65,000-$71,350 range in the following days.
As of this writing, BTC is trading at $65,812, a 4% and 10.3% surge in the weekly and monthly timeframes.

Featured Image from Unsplash.com, Chart from TradingView.com


