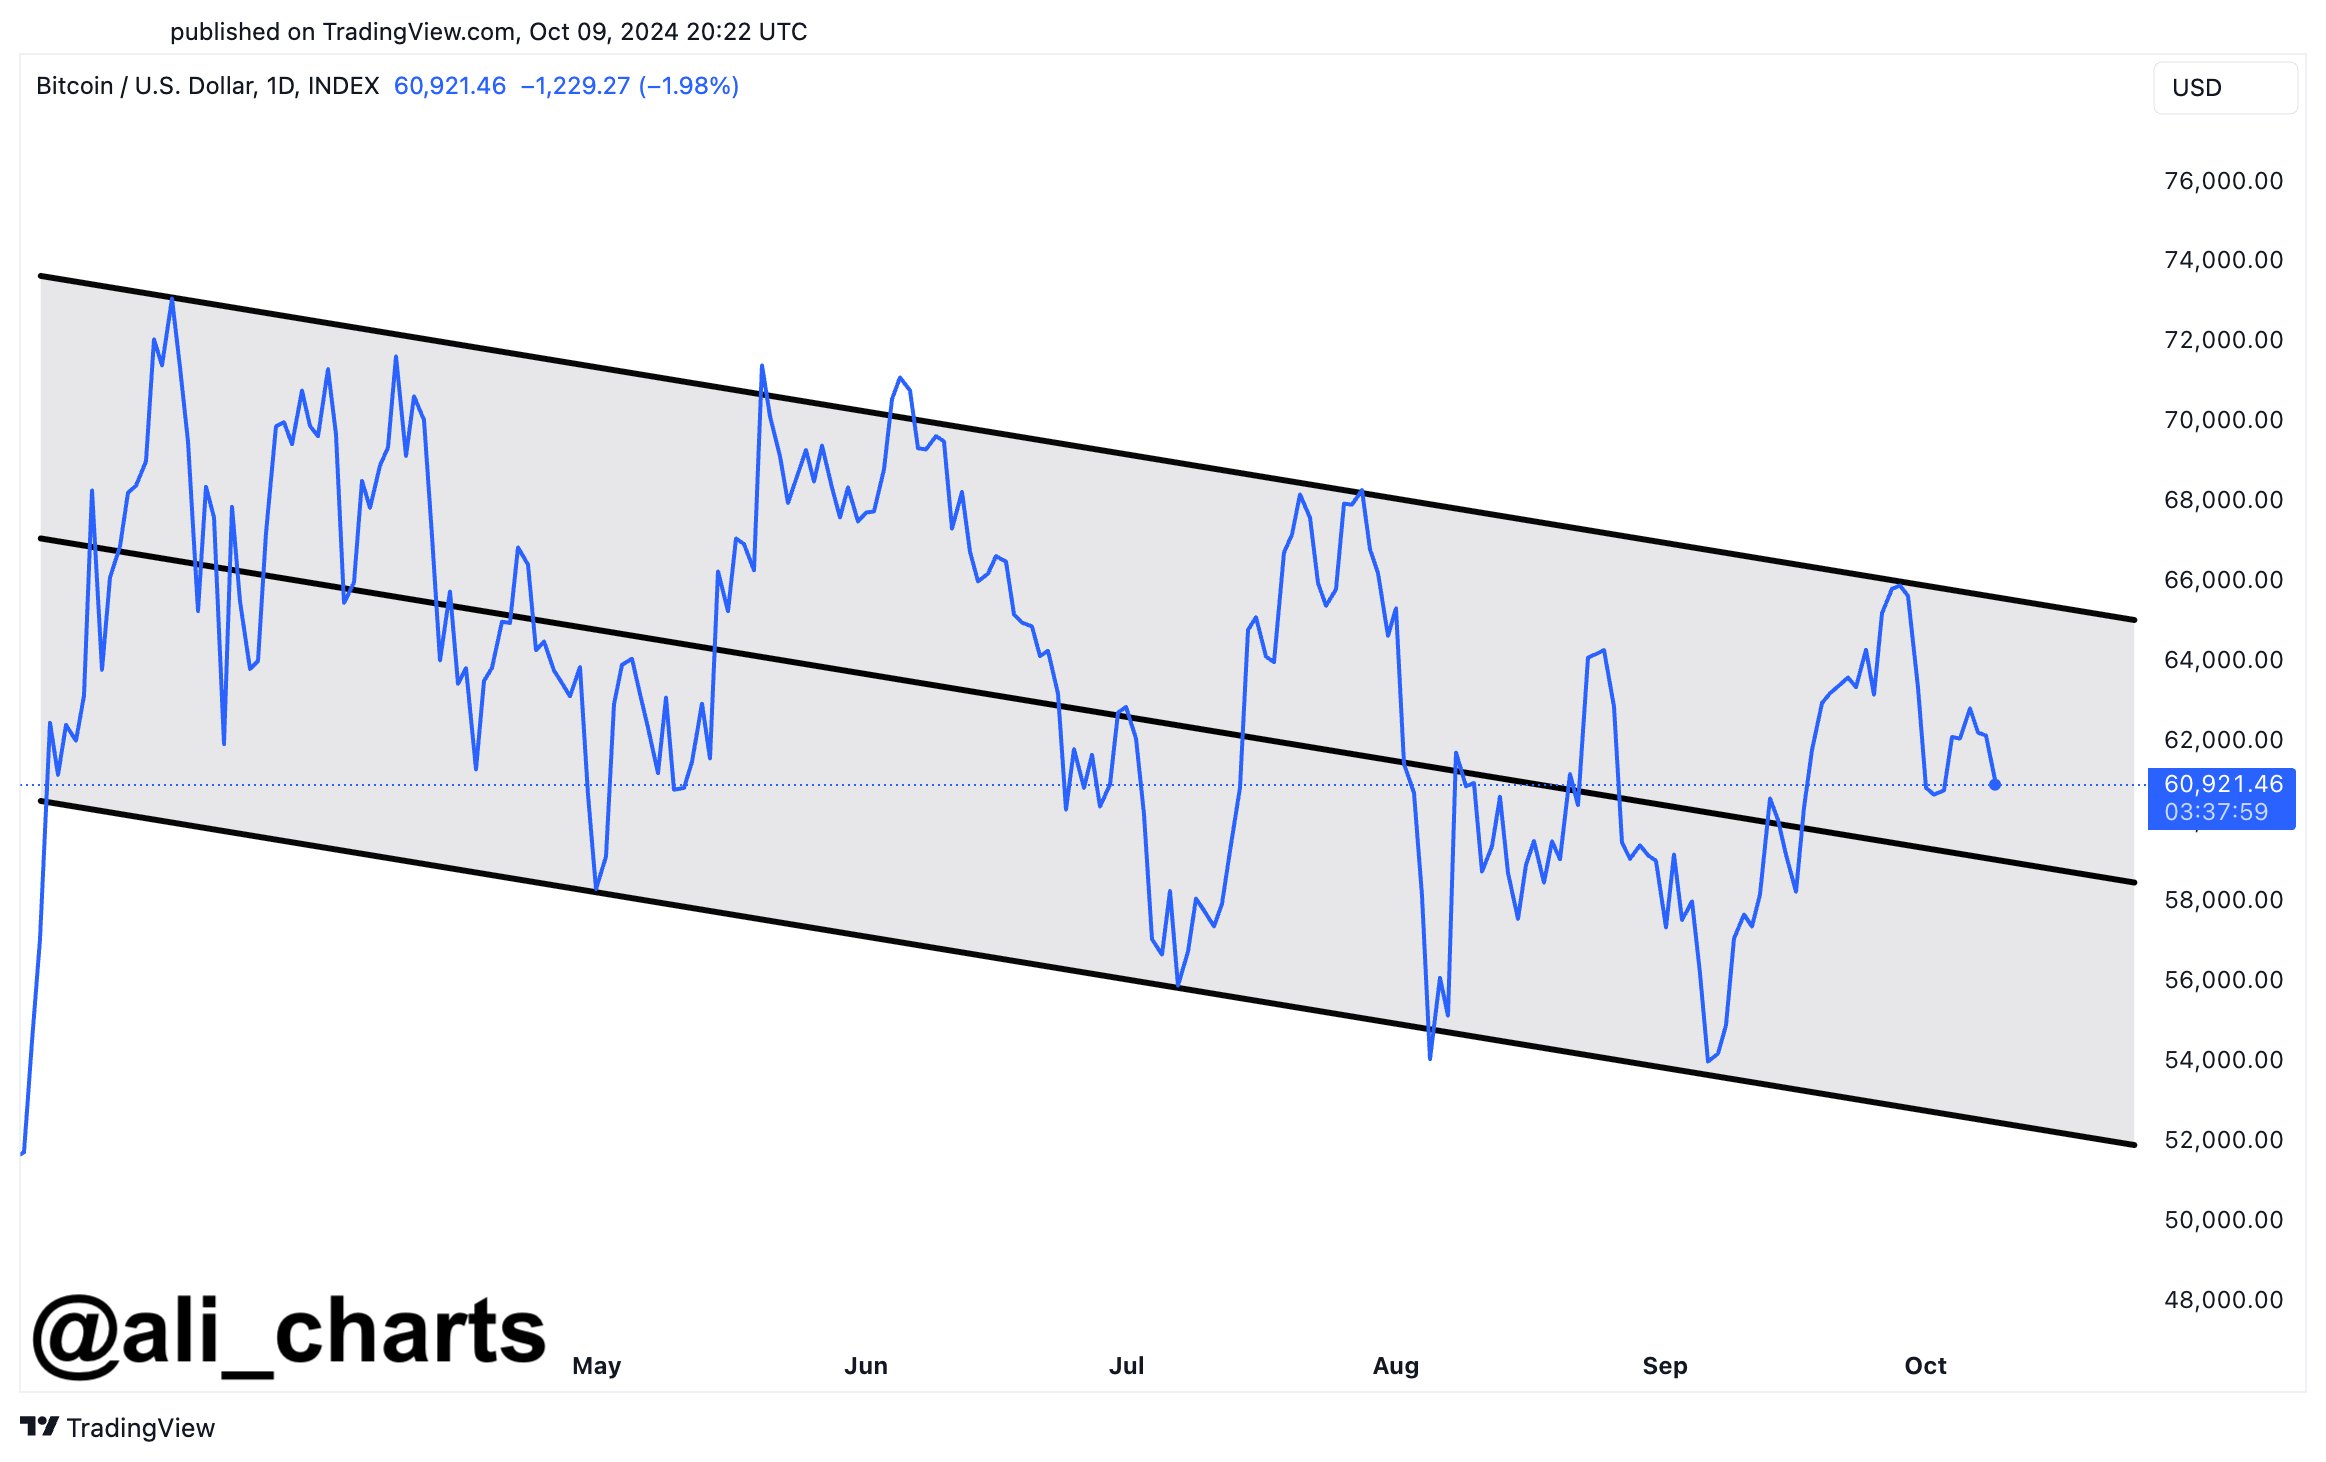
After briefly rising above $63,000 in recent days, renewing investor’s hope on “uptober,” Bitcoin has once again dampened this excitement by decreasing to as low as the $60,000 region today.
This unappealing performance has led to a CryptoQuant analyst, Aytekin, raising and sharing insight on an important question: “Is it reasonable to expect a final shakeout before the next big move?”
Related Reading
Bitcoin Next Move: Major Correction Looming?
In a recent post on the CryptoQuant QuickTake platform, the analyst explained that Bitcoin is currently in a high open interest zone, having exceeded the critical $18 billion level. Historically, when open interest levels reached this point, major corrections followed.
The analyst mentioned that the current market sentiment appears divided, noting:
The market seems indecisive in many aspects, with some believing that the next big upside move is on the horizon, while others think BTC’s downward trend remains strong. A common belief is that BTC may need a final shakeout before surging to a new all-time high (ATH).
Aytekin added that funding rates, though slightly above the 200-day simple moving average (SMA), suggest that long traders are still dominant. However, significant price corrections in the past often occurred when funding rates turned negative, which hasn’t happened yet.

Aytekin concluded that, while a final shakeout might occur, the depth of the correction may not be as severe given the relatively moderate funding rates.
BTC Price Outlook
As Bitcoin has struggled to break through key resistance levels, its recent price action reflects ongoing market indecision. Over the past few weeks, Bitcoin maintained stability above the $60,000 mark, but failed to make a major move to reclaim $70,000.
In the past 24 hours, Bitcoin has slipped by 2.9%, currently trading at $60,485. This decline follows the asset’s brief surge to $63,774 earlier in the week, which sparked optimism for a possible move toward the $65,000 and then $70,000 mark.
Prominent crypto analyst Ali recently commented on Bitcoin’s price action, noting that Bitcoin is still trading within a “descending parallel channel.”

According to Ali, the asset was rejected at the upper boundary of this channel, signalling the potential for further downside. “We might see a drop to the middle boundary at $58,000 or even the lower boundary at $52,000,” Ali noted in a post on X.
Related Reading
He emphasized that a bullish breakout is unlikely unless Bitcoin clears the $66,000 level, a price point that has acted as a significant resistance point in recent weeks.
#Bitcoin remains stuck in a descending parallel channel.
After the recent rejection at the upper boundary, we might see a drop to the middle boundary at $58,000 or even the lower boundary at $52,000. A bullish breakout won’t happen until $BTC clears $66,000! pic.twitter.com/yFvS6jxmKB
— Ali (@ali_charts) October 9, 2024
Featured image created with DALL-E, Chart from TradingView


