Mantra, the popular blockchain network for real-world asset tokenization, rose for three consecutive weeks, paring back the losses it made in July and August.
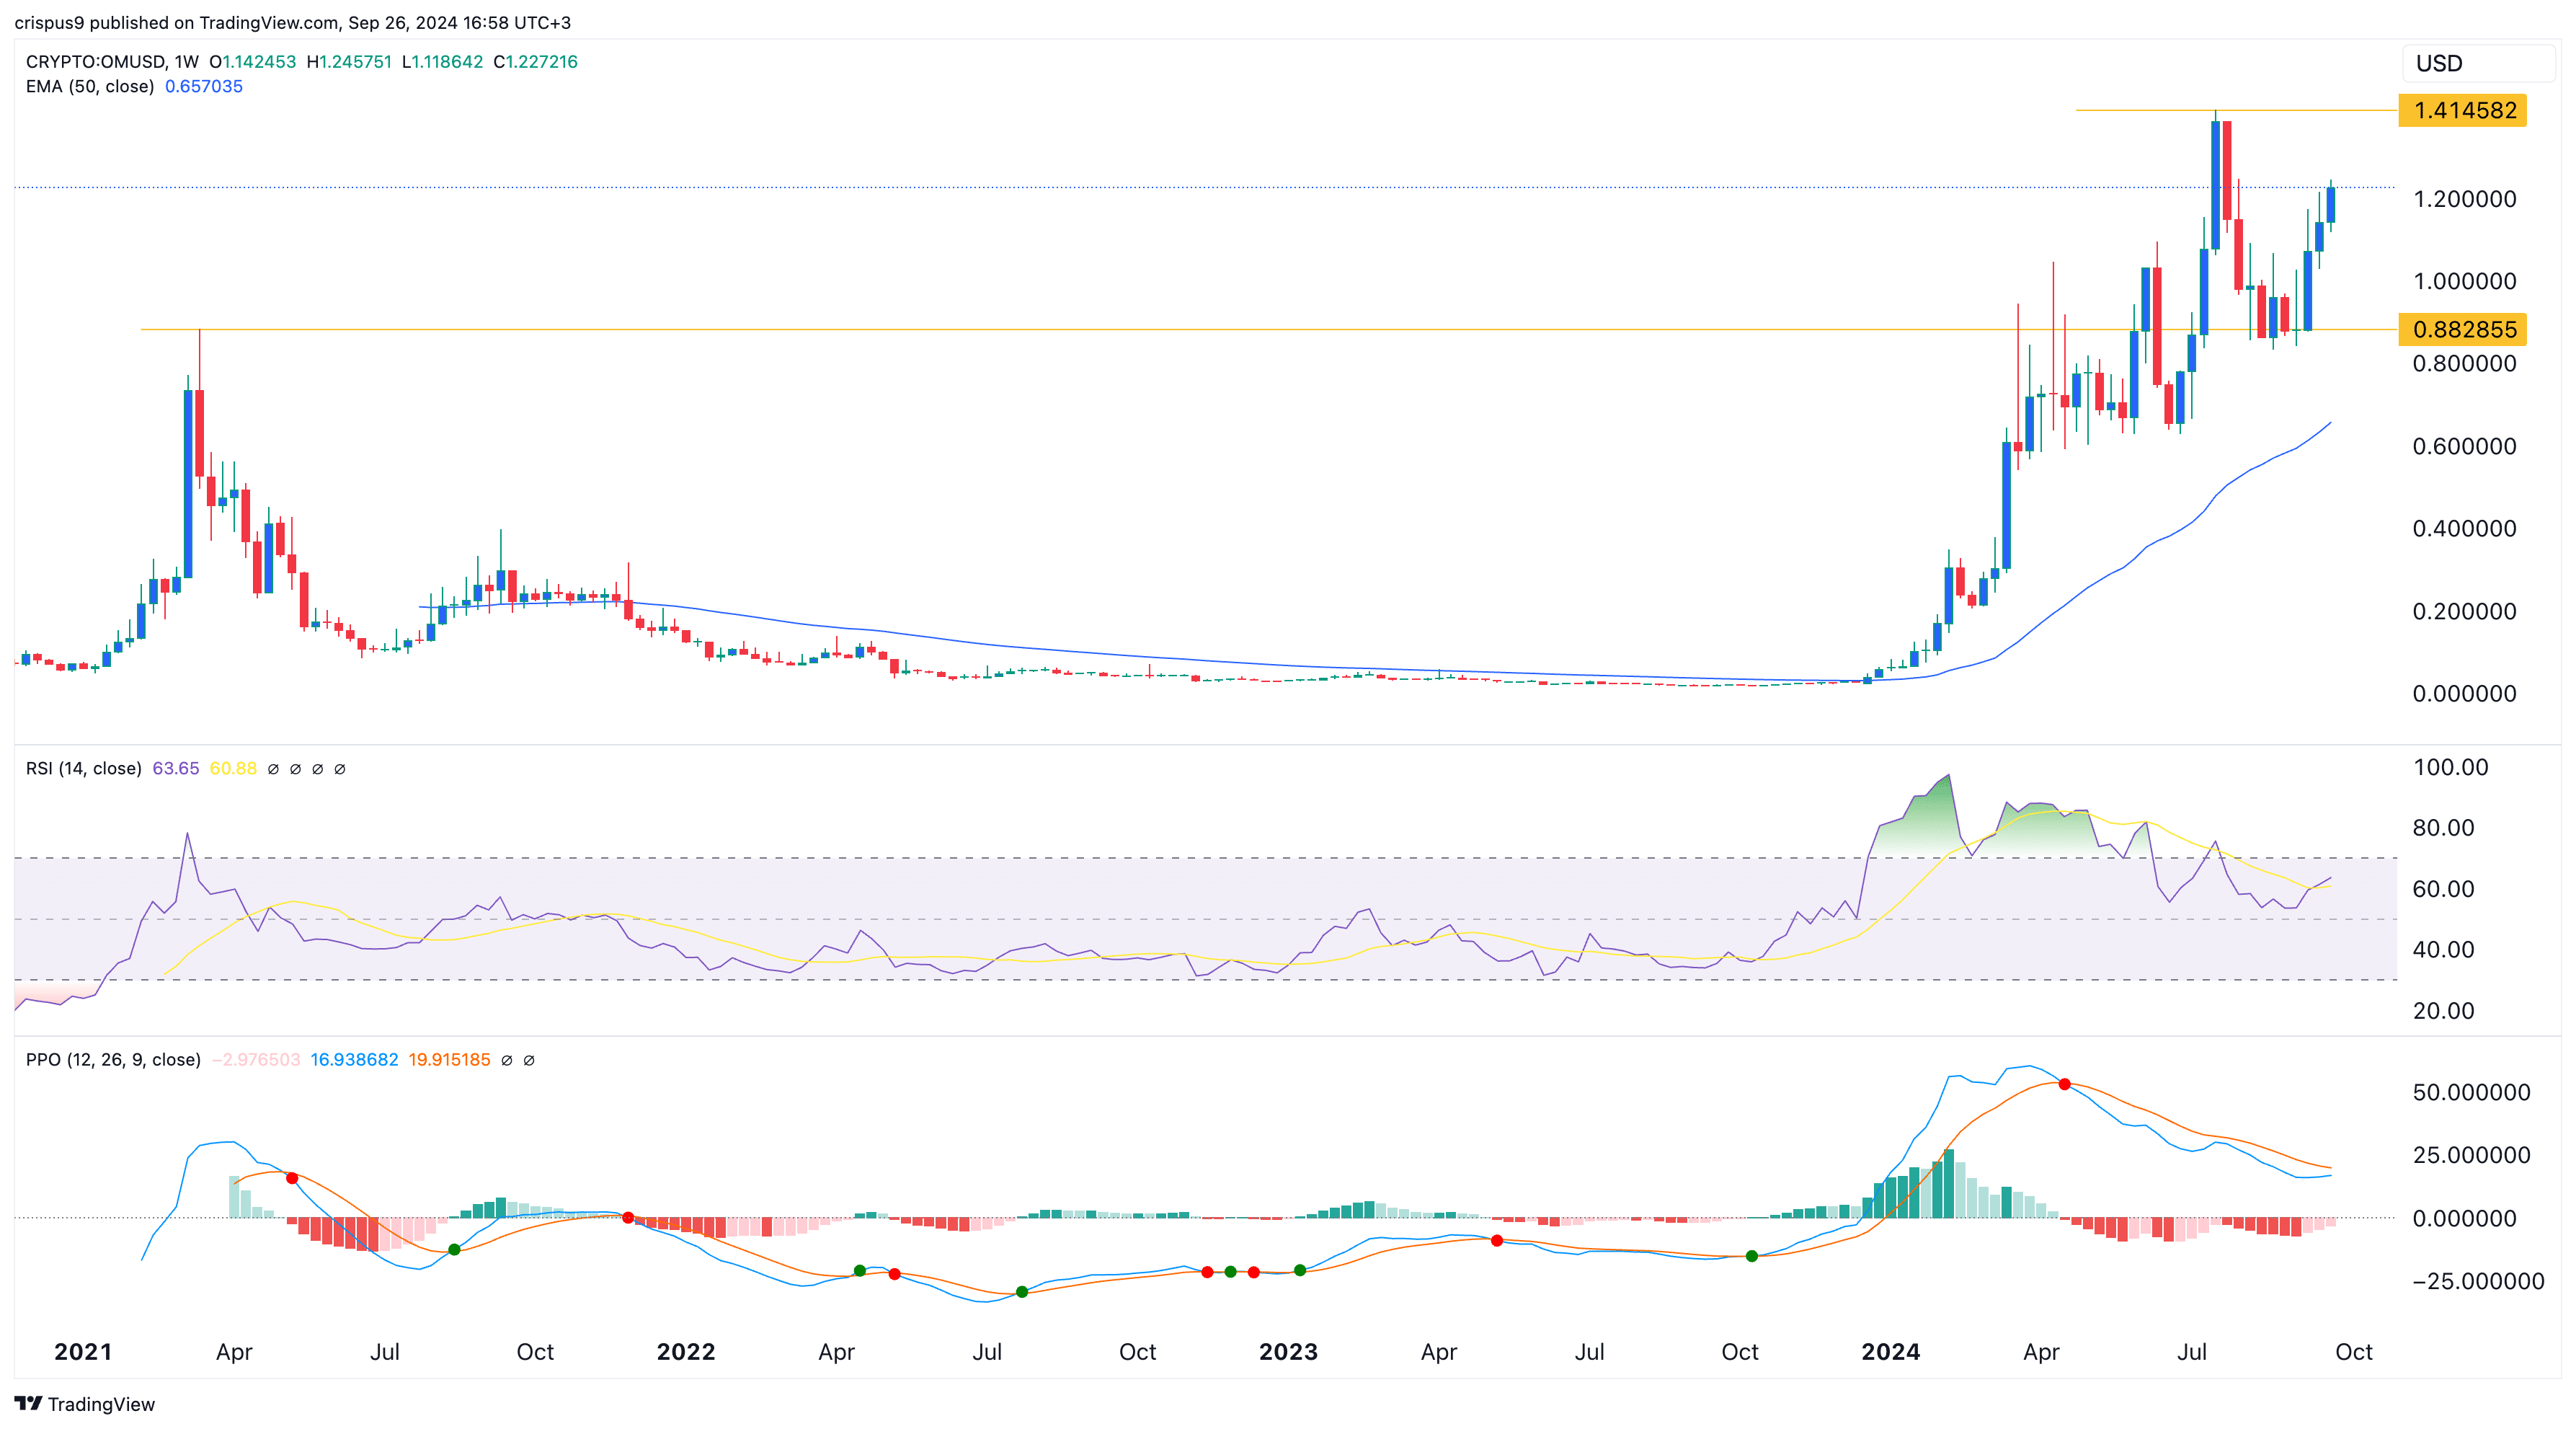
Mantra (OM) rose to a high of $1.24, its highest level since July 29, and 13% below its all-time high of $1.4145. It has been one of the best-performing cryptocurrencies, having surged by over 4,000% from its January lows.
Mantra’s rally has been driven by the growing demand for real-world asset tokenization, which is widely regarded as the next big thing in the crypto industry. For example, Ondo Finance (ONDO), a key player in the industry, has attracted over $600 million in assets.
Similarly, Blackrock’s BUIDL fund has attracted over $500 million in assets, while the Franklin OnChain US Government Money Market Fund holds $427 million.
Mantra has also jumped due to its strong staking yield of 22.2%, which is higher than that of most cryptocurrencies, including (SOL) and Ethereum (ETH).
The most recent catalyst for Mantra’s surge is the upcoming launch of the Wallet mainnet. This is a significant development as the network aims to become the preferred ledger of record for real-world assets.
The chain will feature a verifiable network for security and stability, with institutional-grade capabilities that allow companies of all sizes to deploy capital efficiently. Additionally, the chain will provide global access to tokens by bridging traditional finance and decentralized finance.
Although the final date for the Mantra Chain launch has not been revealed, developers have hinted that it will happen in October. Cryptocurrencies often rally ahead of a major event with the risk of a pull back afterward.
Additionally, OM token has jumped because of the ongoing Mantra Zone competition where winners will share 50 million tokens currently valued at over $60 million.
Mantra targets all-time high

On the weekly chart, Mantra recently retested the important support at $0.8828, which coincided with its highest swing in 2021. A break and retest is one of the most popular continuation signals. OM has remained above the 50-week moving average, indicating that bulls are in control.
However, the Percentage Price Oscillator and the Relative Strength Index have formed a bearish divergence pattern.
Therefore, Mantra will likely rise and retest its all-time high at $1.4145 before resuming its downward trend. Further gains will be confirmed if it flips that resistance level, which would invalidate the double-top pattern.


