Solana (SOL) is currently trading near a critical support zone at $145, following a 26% surge since the Federal Reserve announced interest rate cuts on September 18. After this sharp rise, SOL experienced a slight 10% dip, but the overall market sentiment remains optimistic.
Many analysts and investors hope Solana will reach new all-time highs by the end of the year, driven by positive macroeconomic trends and the growing confidence in the crypto market.
Related Reading
Key data from Coinglass reveals a rising funding rate, which indicates increasing bullish sentiment among traders. This suggests that the recent price correction might only be a temporary pause before another leg higher.
Investors are closely monitoring SOL’s price action, with expectations that a sustained break above $150 could pave the way for a new rally toward uncharted territory. All eyes are now on Solana as it navigates this crucial support level, with both short-term traders and long-term holders anticipating a positive outlook in the coming weeks.
Solana Is Preparing For A Rally
Solana (SOL) is currently holding firm above a crucial support level following a small dip that affected the entire market yesterday. Despite this minor setback, the sentiment among investors and traders remains overwhelmingly positive. Many expect SOL to rally and surpass multi-month highs, given the recent strength in its price action.
Key data from Coinglass highlights that Solana’s funding rate has been on an upward trend since mid-September. Yesterday, it reached 0.0127%, the highest level since late July. A rising funding rate is typically a bullish indicator, signaling growing demand for a token.
The funding rate is a mechanism used in perpetual futures contracts, where it can be either positive or negative. It adjusts based on the price difference between the perpetual contract and the spot price, along with interest rates. When the funding rate is positive, buyers (longs) are paying sellers (shorts), which encourages futures and spot prices to converge.
Related Reading
This rising funding rate for SOL suggests that more traders are betting on the token’s future appreciation, expecting higher prices in the coming weeks. With Solana maintaining its current support and displaying strong market fundamentals, the potential for a significant rally remains high. Investors are now watching closely to see if Solana can break through its next resistance levels and confirm the start of a new bullish phase.
SOL Testing Demand
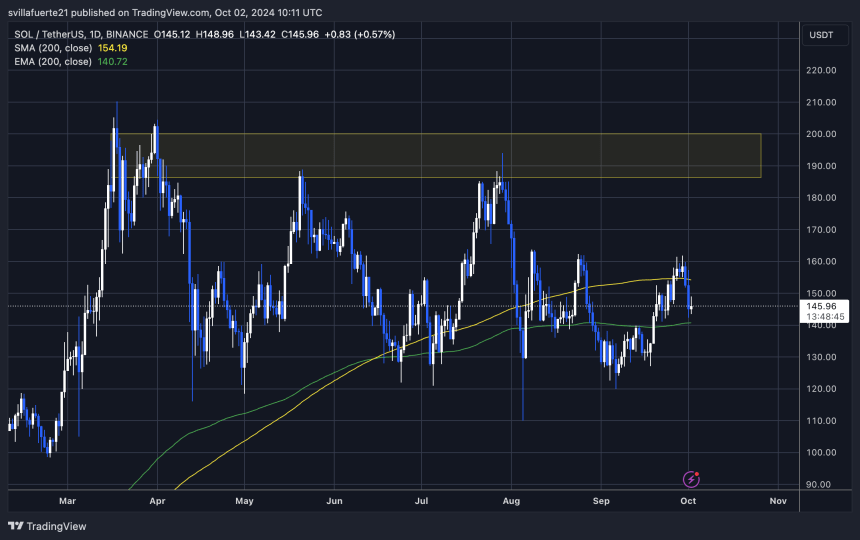
Solana (SOL) is currently trading at $145, holding strong above the daily 200 exponential moving average (EMA) at a critical support level of $140. This key area has proven to be a solid foundation for the price, and if bulls want to ignite an upward rally, they must defend this support zone. For momentum to shift decisively upward, SOL needs to break past the daily 200 moving average (MA), which sits at $154.

A close above the 200 MA would likely trigger a bullish rally, potentially pushing the price toward higher targets. However, failure to maintain this key support and close above these levels could result in extended sideways consolidation or, worse, a deeper correction. In such a scenario, the next demand zone would be around $110, a significant support level that could attract buyers if the market enters a bearish phase.
Related Reading
For now, the $140 support level remains the line in the sand for Solana’s price action. Traders are closely monitoring whether SOL can break through key resistance levels and continue its ascent, or if a potential correction is on the horizon.
Featured image from Dall-E, chart from TradingView


